

OEE vs. OOE vs. TEEP: Why One Metric Was Never Going to Be Enough
OEE tells you how well you ran the time you scheduled. OOE and TEEP reveal how much capacity you never scheduled in the first place. Here's how the three metrics fit together, who should own each one, and how to turn all three into action.
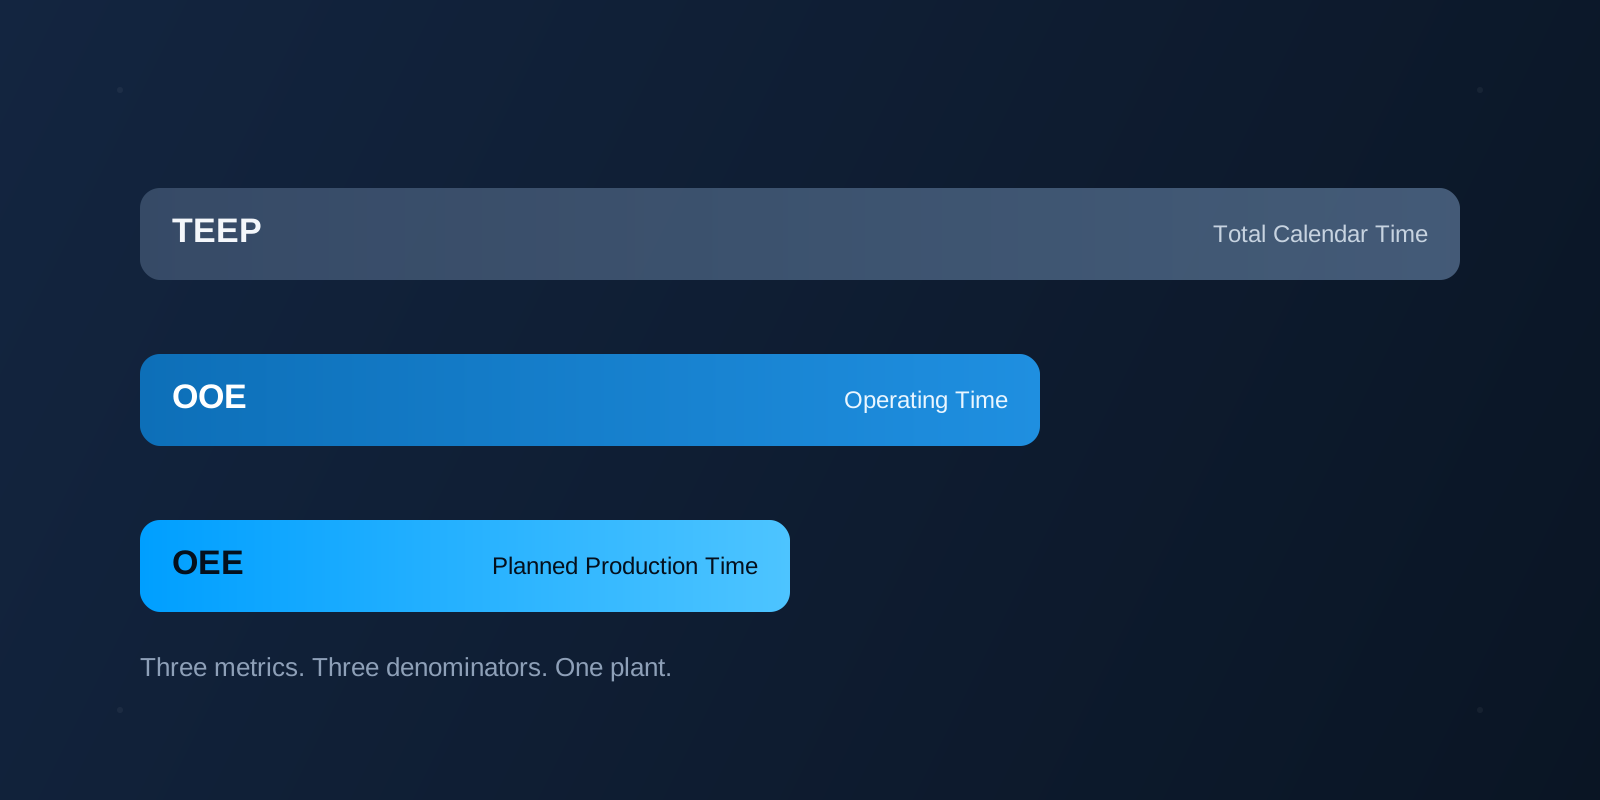
Ask a plant manager how the business is performing and you'll almost always get the same answer: an OEE score. It's become the default language of manufacturing performance, and for good reason, it's simple, it's ownable, and it drives real behavior change on the floor. But here's the question that stops most leadership teams cold: what is that OEE score actually measuring against?
The honest answer is whatever time someone decided to schedule. OEE only ever grades you on the hours you chose to run. It never asks whether you scheduled the right number of hours, or whether there was more capacity sitting on the table that nobody scheduled at all. That's not a flaw in OEE, it's a blind spot. And it's exactly the blind spot that Overall Operations Effectiveness (OOE) and Total Effective Equipment Performance (TEEP) exist to close.
None of these metrics compete with each other. They stack. And once you see how they stack, you stop asking "what's our OEE?" and start asking a more useful question: which layer of our capacity is actually the problem?
OEE: The Score Your Production Team Owns
Overall Equipment Effectiveness is the metric most manufacturers start with, and for the plant floor, it's still the right one. OEE = Availability × Performance × Quality, measured against Planned Production Time, the hours someone already decided the line would run.
That scope is exactly what makes OEE work as a motivational tool. Operators control when the line runs, how fast it runs, and how much good product comes off the end of it. A late material delivery doesn't touch OEE. A soft sales forecast doesn't touch OEE. That's the whole point, it's a scoreboard the production team can actually win or lose on their own.
But that same narrow scope is what makes OEE dangerous in a leadership meeting. A line running at 78% OEE sounds like a line with a minor efficiency problem. It says nothing about whether that line was only scheduled for one shift when it could have run three, or whether it sat idle for two full days waiting on orders that never got planned. OEE was never built to answer that question. It isn't supposed to.
OOE: What Happens When You Stop Excluding Time
Overall Operations Effectiveness asks a bigger question: how well did we use the time the plant was actually open, staffed, and available, whether or not anyone scheduled production during it? Instead of measuring against Planned Production Time, OOE measures against Operating Time, every hour a line could have been running because people were on the clock and the plant was open for business.
The gap between OEE and OOE is where scheduling and utilization losses live, and two of the most familiar culprits are ones your team already lives with every day: changeovers and breaks.
A scheduled changeover, cleanly executed, barely touches OEE, it's already built into Planned Production Time. The problem is the changeover that runs long: a crew that didn't stage materials in advance, a formula that needed three extra centerline checks, a changeover nobody actually timed. That overrun doesn't show up in OEE, because it was never part of the plan to begin with. It just quietly eats into the next job's start time, and unless you're measuring the full Operating Time window, it disappears completely.
Breaks and lunch have the same blind spot, just less obvious. It's tempting to block out a fixed 30-minute lunch and a couple of 10-minute breaks on the schedule and call the time accounted for. But real breaks run long, shift changes run late, and if your system just assumes a blank block instead of capturing when a break actually started and stopped, you lose the ability to tell the difference between a team taking the time it's owed and a line quietly bleeding unplanned downtime. Track the actual time, the same way you'd track a changeover or a downtime event, and Operating Time starts reflecting what really happened on the floor instead of what the schedule assumed would happen.
OOE is where production and scheduling or planning have to start talking to each other. It's no longer just "how did the line run," it's "why didn't the line run at all, during hours we were already paying for it to be available?"
TEEP: The Question Your Capital Budget Actually Needs Answered
Total Effective Equipment Performance goes one layer further still. It measures against every hour that exists, all 8,760 hours in a calendar year, whether the plant was staffed or not. TEEP = OEE × Utilization, where Utilization is simply Planned Production Time divided by total calendar time.
This is the metric that reveals what manufacturing consultants call the "hidden factory": the production capacity that already exists inside your four walls, sitting unused, that nobody has to spend capital to create. A plant with a respectable 65% OEE can easily be sitting on a TEEP in the 20s, and that gap is either your cheapest expansion project or your strongest argument against the next capital request, depending on what you decide to do with it.
TEEP is a leadership and finance conversation, not a shift-floor scoreboard. Nobody expects an operator to control whether the plant runs a third shift. But somebody in the building should be able to answer, with data instead of a guess, whether the next unit of demand needs a new line or just a better schedule.
OEE vs. OOE vs. TEEP at a Glance
Same plant, same equipment, three different questions. Here's how the three metrics compare side by side, who's actually involved in each one, and what each puts in front of your leadership team.
| Metric | Measures Against | Teams Involved | What It Tells Leadership |
|---|---|---|---|
| OEE Overall Equipment Effectiveness | Planned Production Time — the hours you scheduled the line to run | Operators & line supervisors | How well the team executed the time it chose to run |
| OOE Overall Operations Effectiveness | Operating Time — every hour the plant was staffed and available | Production & scheduling / planning | How much of your paid, available time actually turned into a production plan |
| TEEP Total Effective Equipment Performance | Calendar Time — all 8,760 hours in the year | Plant & executive leadership, finance | The true production ceiling — the case for a new shift vs. new equipment |
The Hidden Factory: One Customer's Way of Explaining It
Numbers on a page rarely land the way a picture does. One Essembi customer built exactly this kind of visual for their own leadership team, stacking their calendar time, operating time, and planned production time as nested bars so everyone in the room could see, at a glance, how much capacity was disappearing at each layer before OEE ever entered the conversation. It's a simple way to make the same point: OEE isn't wrong, it's just answering a smaller question than the one leadership is usually asking.
Every hour that exists — 8,760 hours a year, staffed or not.
Hours the plant is staffed and available, whether or not a job was scheduled.
The hours someone actually scheduled the line to run.
What actually shipped, at ideal speed, right the first time.
Same plant. Same results. Three very different numbers, depending on what you measure against.
In the example above, that plant's OEE of 60% looks solid on a scorecard. Its OOE of 45% tells a different story, nearly half of the plant's paid hours never produced anything. And its TEEP of 27% is the number that actually belongs in a capital planning conversation, not because 27% is a bad score, but because it's the real ceiling this plant is operating under today, without spending a dollar on new equipment.
Which Metric Should Your Team Actually Use?
Not one. All three, pointed at the right audience. Handing an operator a TEEP target is as demotivating as handing a CFO an OEE score, neither person can act on a number scoped to someone else's decisions. The teams that get real value out of this framework don't pick a favorite metric, they match each metric to the team that can actually move it:
- OEE belongs to the production floor — operators and supervisors, driving daily execution and shift accountability
- OOE belongs to production and scheduling/planning together — surfacing the utilization and changeover losses neither team can fix alone
- TEEP belongs to plant and executive leadership — informing the shift-addition, headcount, and capital equipment decisions only they can make
Skip a layer and you lose a decision. Track only OEE and your leadership team is making capital decisions blind to the hidden factory sitting on your own floor. Track only TEEP and you've handed your operators a number they have zero ability to influence, which is the fastest way to kill the engagement OEE was supposed to build in the first place.
Measure. Improve. Control. All Three Layers, One Platform.
This is exactly the discipline Essembi is built around: measure, improve, control, applied not just to one score, but to every layer of capacity your business actually has.
- Measure — Essembi captures the same real-time production, downtime, and scheduling data once, down to the actual start and stop time of every changeover, break, and lunch instead of a blank placeholder block, then calculates OEE, OOE, and TEEP from it automatically, no separate spreadsheet for each metric, no reconciling three different "truths" before a leadership meeting
- Improve — because every metric is broken down into its own losses, your team knows exactly which layer to fix next: a downtime root cause for OEE, a scheduling gap for OOE, or a capacity investment case for TEEP
- Control — real-time dashboards keep every layer visible to the team that owns it, operators see their OEE shift to shift, plant leaders see OOE and TEEP trending over time, so gains get locked in instead of quietly eroding after the next audit
The plants that outperform their industry aren't the ones with the best single number. They're the ones with visibility into all three layers, and a platform that turns that visibility into action every single day.
Where to Go From Here
If you're ready to see what any of this is worth in dollars, turn an OEE improvement into real labor savings and capacity gains for your own plant.
Ready to transform your plant floor?
See how Essembi drives real results for your manufacturing team with a personalized demo.
More from the blog

Ask Your Plant Floor Data a Question with AI
Essembi's new AI chat lets manufacturing leaders ask questions about downtime, maintenance, and quality, then dig deeper with follow-ups.
Read more
Know Exactly What Every Job Costs With RFID Labor Tracking
Track labor costs from changeover to the last unit off the line with RFID badge scanning built into Essembi.
Read more
The Power of Manufacturing Huddles: Building a Culture of Continuous Improvement on the Shop Floor
How start and mid-shift team huddles drive continuous improvement, boost efficiency, and build engaged manufacturing teams that deliver results.
Read more